South Bay vs. Westside: Which Los Angeles Real Estate Market Is Winning Right Now?
If you are comparing South Bay real estate vs. Westside Los Angeles real estate, the latest closed sales show two strong markets behaving in noticeably different ways.
Looking at single-family home sales closed during the last 60 days, the South Bay is currently winning when it comes to speed and market velocity, while the Westside holds an edge in average home price, price per square foot and sale-to-list price performance.
The South Bay markets analyzed include Manhattan Beach, Hermosa Beach, Redondo Beach and Torrance. The Westside markets include Mar Vista, Marina del Rey, Venice, Santa Monica, Westchester and Culver City.
So which Los Angeles housing market is performing better right now?
The short answer: South Bay homes are selling considerably faster, while Westside homes are selling at slightly stronger prices relative to their asking prices.
That distinction tells us quite a bit about buyer demand heading toward the end of 2026.
South Bay vs. Westside Real Estate: The Quick Answer
Over the last 60 days, the average South Bay single-family home sold in approximately 22 days, compared with approximately 31 days on the Westside.
That means the average South Bay home is selling roughly 29% faster.
The difference becomes even clearer when looking at median days on market. The median South Bay home sold after only 10 days on the market, compared with 17 days on the Westside.
The Westside, however, currently has the higher average sale price at approximately $2.68 million, compared with approximately $2.47 million in the South Bay.
Westside homes also averaged approximately $1,289 per square foot, compared with approximately $1,211 per square foot in the South Bay.
When it comes to negotiating against asking price, the markets are extremely close. Westside homes averaged approximately 100.74% of their final list price, compared with approximately 100.40% in the South Bay.
Perhaps the most interesting statistic: approximately 35% of homes in both markets sold above their final asking price.
In other words, neither side of Los Angeles has a monopoly on competitive offers.
Another Interesting Statistic: How Many Homes Sell Within Two Weeks?
Looking beyond simple averages provides another useful perspective on market velocity.
A substantial portion of South Bay homes in the dataset sold within their first two weeks on the market. That reinforces what the overall DOM numbers are already showing: well-priced South Bay homes are being absorbed quickly.
This is especially relevant because days on market can sometimes be distorted by a smaller number of listings that sit for extended periods. Looking at both average and median DOM helps provide a more complete picture.
And in the South Bay, both metrics point in the same direction: buyers are moving quickly.
Which Individual Los Angeles Market Is Selling Homes the Fastest?
Among the individual markets analyzed, Culver City recorded the lowest average days on market at approximately 20 days, narrowly ahead of Torrance at approximately 20 days and Manhattan Beach at approximately 22 days.
But Manhattan Beach produced one of the most interesting statistics in the entire study.
The median Manhattan Beach home sold after only five days on the market.
That is especially noteworthy considering Manhattan Beach also had the highest average sale price of every market analyzed at approximately $5.28 million.
In other words, Manhattan Beach isn't simply a high-value luxury market. Based on these recent sales, properly positioned homes can also move extremely quickly.
Which Market Has the Highest Home Prices?
Among all ten markets analyzed, Manhattan Beach had the highest average sale price at approximately $5.28 million.
Santa Monica ranked second at approximately $4.03 million, followed by Hermosa Beach at approximately $3.49 million.
At the regional level, however, the Westside had the higher average.
The average Westside single-family home in the dataset sold for approximately $2.68 million, compared with approximately $2.47 million in the South Bay.
That is an important distinction. The Westside is more expensive on average across the group, but Manhattan Beach remains the highest-priced individual housing market in this comparison.
Where Is the Highest Price Per Square Foot?
Manhattan Beach also led every individual market in average closed price per square foot at approximately $1,939 per square foot.
Santa Monica followed at approximately $1,775 per square foot, with Hermosa Beach at approximately $1,401 per square foot.
This is another reason broad regional averages can be misleading.
A buyer comparing a $3 million home in Manhattan Beach with a $3 million home elsewhere in Los Angeles may be shopping at the same price point but buying very different amounts of land, square footage, location and proximity to the beach.
Even within Manhattan Beach itself, values can vary substantially between the Sand Section, Tree Section, Hill Section and East Manhattan Beach. Current listing data similarly shows major price-per-square-foot differences between individual Manhattan Beach neighborhoods.
The same principle applies throughout the South Bay and Westside: location within the city can matter almost as much as the city itself.
Which Market Is Getting Sellers Closest to — or Above — Asking Price?
This category goes narrowly to the Westside.
Westside single-family homes averaged approximately 100.74% of final list price, while South Bay homes averaged approximately 100.40%.
Both numbers are significant because an average above 100% means competitive sales are strong enough to offset properties that sell below asking.
Several individual Westside markets showed particularly strong pricing performance.
Marina del Rey and Santa Monica were among the strongest markets in the dataset for sale-to-list price performance, while Mar Vista and Culver City also demonstrated strong results.
In the South Bay, Torrance and Redondo Beach stood out for their sale-to-list performance.
Where Are Buyers Most Aggressive?
Some individual markets stand out.
Marina del Rey recorded one of the highest percentages of homes selling above asking price in the dataset. Torrance, Mar Vista, Westchester, Redondo Beach and Culver City also showed meaningful levels of over-asking sales.
This creates an interesting contrast.
The highest-priced neighborhoods aren't necessarily the neighborhoods where buyers are most frequently bidding over asking.
Markets offering a compelling combination of location, relative value and limited inventory can create intense competition even when their average sale prices are considerably lower than Manhattan Beach or Santa Monica.
Manhattan Beach Is an Interesting Outlier
Manhattan Beach deserves its own discussion because its numbers don't behave exactly like the broader South Bay.
The average Manhattan Beach home in the dataset sold for approximately $5.28 million, by far the highest average of any city analyzed.
Average closed price per square foot was approximately $1,939, also the highest of the ten markets.
Yet median days on market was only five days.
High prices normally reduce the potential buyer pool. Manhattan Beach's recent numbers show that demand for the right properties can remain exceptionally strong even at significantly higher price points.
For anyone researching the Manhattan Beach real estate market in 2026, this combination of high values and short marketing periods is one of the more notable findings from the data.
Redondo Beach and Torrance Tell a Different South Bay Story
Not every South Bay buyer is shopping at Manhattan Beach price levels.
That is where Redondo Beach and Torrance become particularly important.
Redondo Beach averaged approximately $2.02 million in this dataset, while Torrance averaged approximately $1.32 million.
Torrance also had one of the lowest average days-on-market figures of any market analyzed at approximately 20 days.
That combination suggests buyers looking for South Bay access at lower price points than Manhattan Beach or Hermosa Beach are still competing for available single-family homes.
Redondo Beach similarly offers buyers a broad range of neighborhoods and price points, from North Redondo to South Redondo and the Hollywood Riviera area.
Why Price Per Square Foot Doesn't Tell the Whole Story
One of the biggest mistakes buyers can make when comparing the South Bay and Westside is looking only at price per square foot.
A home isn't a commodity.
In Manhattan Beach, buyers may pay significant premiums for ocean views, walk streets, proximity to downtown, larger lots or a specific school district.
In Hermosa Beach, proximity to the Strand, Pier Avenue and walkability can substantially influence value.
In Redondo Beach, the difference between North Redondo, South Redondo and neighborhoods near Riviera Village can materially change pricing.
The same applies on the Westside.
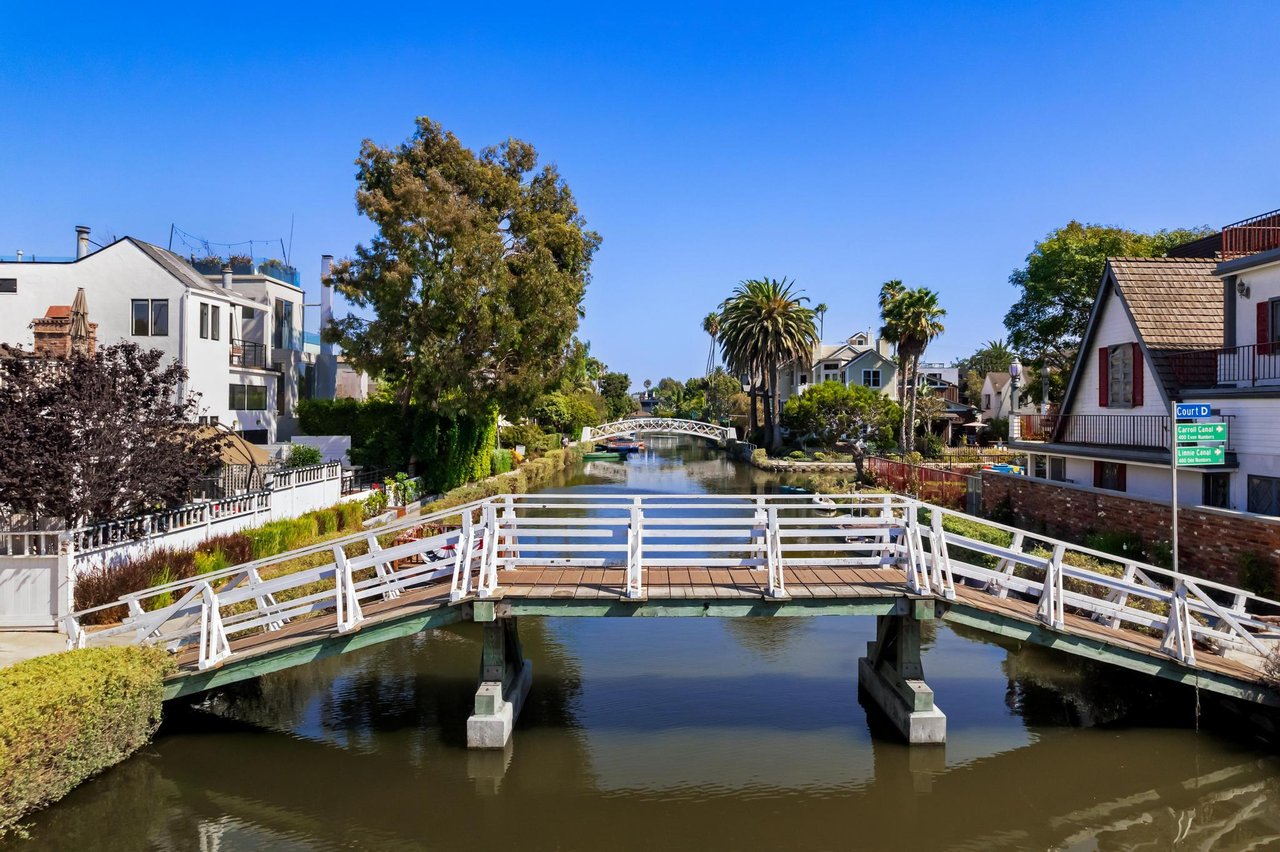
A Venice home near Abbot Kinney can trade very differently from another Venice property only a short distance away. Santa Monica pricing can change significantly based on location north or south of Montana Avenue, proximity to the beach and school district. Mar Vista, Culver City, Marina del Rey and Westchester each attract different buyer profiles.
This is why automated home valuations and broad city averages have limitations. Comparable sales need to be evaluated at the neighborhood—and sometimes block-by-block—level.
South Bay vs. Westside: Where Do You Get More House for the Money?
The data gives buyers another useful way to think about the comparison.
At approximately $1,211 per square foot for the South Bay versus $1,289 per square foot for the Westside, the South Bay as a whole provided slightly more square footage per dollar during this 60-day period.
But the regional averages hide enormous variation.
Manhattan Beach was considerably more expensive per square foot than the Westside average, while Torrance was considerably less expensive.
That means buyers deciding between the Westside and South Bay shouldn't necessarily begin with the region.
They should begin with their budget and lifestyle priorities, then identify which individual neighborhoods offer the best fit.
Which Market Looks Stronger Heading Toward the End of 2026?
Based solely on the latest 60 days of closed single-family home sales, I would give the South Bay a slight edge in current market momentum.
The reason isn't that South Bay homes are appreciating faster—the data does not establish that.
It's market velocity.
South Bay homes are selling materially faster while still maintaining strong sale-to-list ratios and a similar percentage of over-asking sales.
That combination suggests buyers are absorbing South Bay inventory efficiently.
The Westside remains extremely competitive, particularly in markets such as Santa Monica, Marina del Rey, Mar Vista and Culver City. But Venice's longer average market time creates a noticeable drag on the broader Westside numbers.
Neither region should be treated as one homogeneous market.
So, Is the South Bay or Westside Winning?
Call it a split decision—with a slight current momentum advantage to the South Bay.
South Bay wins on speed.
Homes are selling faster and median days on market are lower.
Westside wins on overall pricing.
Average sale price and average price per square foot are higher across the region.
Westside narrowly wins on sale-to-list ratio.
The margin, however, is small.
Over-asking sales are essentially a tie.
Roughly 35% of recent sales in both markets closed above their final asking price.
Manhattan Beach wins the luxury price category.
At approximately $5.28 million, Manhattan Beach had the highest average sale price of every individual market analyzed—and it also posted the highest average price per square foot.
The broader takeaway is that both coastal Los Angeles markets remain competitive, but buyers are currently absorbing South Bay inventory faster.
For homeowners considering selling in Manhattan Beach, Hermosa Beach, Redondo Beach or Torrance, that is an encouraging signal heading toward the end of the year.
For buyers deciding between the South Bay and Westside, the numbers reinforce why the decision should go beyond price alone. Lifestyle, schools, commute, walkability, lot size, beach access, neighborhood character and the amount of home you receive for your budget can ultimately matter more than which region "wins" a statistical comparison.
And for anyone trying to determine what a specific home is worth, citywide averages are only the starting point. In coastal Los Angeles real estate, values can change dramatically within a few blocks.
About the Data
This analysis uses closed single-family home sales from the most recent 60-day dataset provided, covering Manhattan Beach, Hermosa Beach, Redondo Beach and Torrance in the South Bay and Mar Vista, Marina del Rey, Venice, Santa Monica, Westchester and Culver City on the Westside.
The analysis focuses on closed sale price, price per square foot, days on market, sale-to-list price ratio and the percentage of properties closing above the asking price.
Recent sales statistics are a snapshot of current market activity and should not be interpreted as a guarantee of future appreciation or market performance.
Disclaimer:
The information provided is for general informational purposes only and should be independently verified. This website is not intended to provide real estate, legal, tax, or investment advice. Before making any decision to purchase, sell, lease or invest in property, consult with your licensed real estate professional, real estate attorney, and tax professional.