South Bay Luxury Market Report: What $5M+ Home Sales Tell Us About 2026
Quick answer: Through mid-July 2026, the South Bay's $5M+ single-family home market (Manhattan Beach, Hermosa Beach, and Redondo Beach) has produced 75 closed sales totaling roughly $573 million in volume. Manhattan Beach dominates on sale count (60 sales), Hermosa Beach commands the highest price per square foot (average $2,548/sqft), and nearly 39% of all $5M+ sales closed off-market, a sign of how tight and relationship-driven this tier of the market has become. Rates dipped to 5.98% in February before climbing back toward 6.5% by July, and SpaceX's June IPO is starting to show up in early buyer activity, particularly in Manhattan Beach and El Segundo-adjacent neighborhoods.
Below is the full breakdown, city by city, with the data behind it.
The Data Set
This report covers 75 closed single-family home sales at $5,000,000 and above across Manhattan Beach, Hermosa Beach, and Redondo Beach, year-to-date through mid-July 2026, sourced directly from MLS closed sales records.
City-by-City Snapshot
- Manhattan Beach: 60 sales · $428.2M total volume · $7.14M average price · $6.36M median price · $2,064 average $/sqft · 32.5 average days on market · 7 median days on market · 99.0% average sale-to-list ratio · 35% sold off-market
- Hermosa Beach: 13 sales · $123.2M total volume · $9.48M average price · $9.25M median price · $2,548 average $/sqft · 25.2 average days on market · 0 median days on market · 97.6% average sale-to-list ratio · 61.5% sold off-market
- Redondo Beach: 2 sales · $22.0M total volume · $11.0M average price · $11.0M median price · $1,502 average $/sqft · 154.5 average days on market · 87.8% average sale-to-list ratio · 0% sold off-market
What this tells us:
- Manhattan Beach is the volume engine. With 60 of the 75 qualifying sales, MB is where the $5M+ market actually lives day to day. It's deep enough to draw real conclusions from, and it's the most liquid ultra-luxury market in the South Bay.
- Hermosa Beach is the price-per-square-foot leader. A smaller, denser inventory (particularly Strand and walkstreet properties) pushes HB's per-foot pricing well above Manhattan Beach and Redondo Beach. Buyers are paying a premium for land and location, not just square footage.
- Redondo Beach is a two-sale sample this year, not enough volume yet to call a trend, but both sales (including a $17M Paseo De La Playa closing) point to a market that can produce trophy results when the right property hits, even if it takes longer to find the buyer.
Price Per Square Foot: Where the Premiums Really Are
Across all three cities, the combined average is $2,134/sqft, but that number hides a wide range worth understanding:
- Hermosa Beach commands the steepest premium at an average of $2,548/sqft, driven by Strand and walkstreet lots where the land, ocean proximity, and scarcity matter more than the size of the house.
- Manhattan Beach sits in the middle at an average of $2,064/sqft, reflecting a broader mix of Sand Section, Tree Section, and Hill Section product.
- Redondo Beach trails at $1,502/sqft, largely a function of larger lot sizes and fewer direct oceanfront comps at this price point.
- Pool homes sold for meaningfully more, an average of $8.6M versus $7.3M for homes without a pool, though this also correlates with larger, newer construction.
- Per-square-foot pricing is not just about the house: it's about the address. The highest $/sqft sales in this data set are concentrated on The Strand and immediate walkstreets (several exceeding $3,000–$4,000/sqft), while similarly sized homes even a few blocks inland trade at less than half that rate.
The takeaway for buyers and sellers: square footage alone doesn't determine value at the $5M+ level: location and lot do. Two homes of similar size can trade at very different prices per square foot depending on where they sit. A smaller home directly on The Strand will typically command a higher price per square foot than a larger home a few blocks inland in the Tree Section, because buyers at this level are paying for the address as much as the square footage.
Days on Market and the List-to-Close Correlation
One of the clearest patterns in this data set is how days on market relates to what a seller actually nets relative to list price:
- 0 days (off-market): 99.9% average sale-to-list ratio · 29 sales
- 1–14 days: 105.0% average sale-to-list ratio · 16 sales
- 15–30 days: 96.6% average sale-to-list ratio · 9 sales
- 31–60 days: 89.5% average sale-to-list ratio · 7 sales
- 61–90 days: 95.6% average sale-to-list ratio · 5 sales
- 90+ days: 92.9% average sale-to-list ratio · 9 sales
The pattern is clear and consistent with what we see in the field:
- Homes that sell fast, sell strong. Properties that go under contract within two weeks of listing sold for an average of 105% of list price, which is the "priced right, marketed right, multiple offers" zone.
- The longer a home sits, the more price erosion follows. Once a listing crosses the 30-day mark, sale-to-list ratios drop into the high 80s to low 90s, and price reductions become common.
- Off-market deals close remarkably close to asking (99.9% average), which makes sense, as these are typically negotiated privately between a seller and a specific buyer, with pricing agreed upon before the property is ever "tested" publicly.
Bottom line: in this price tier, the first two weeks on market are the most important window a listing will ever have. Sellers who price accurately out of the gate are consistently rewarded; sellers who chase the market with price reductions are consistently punished.
Off-Market Sales: A Bigger Share of the Luxury Market Than Most Realize
This is one of the most important findings in the data.
38.7% of all $5M+ single-family home sales across Manhattan Beach, Hermosa Beach, and Redondo Beach YTD closed with zero days on market, meaning they sold off-market, before ever hitting the open MLS.
Broken down by city:
- Hermosa Beach: 61.5% of $5M+ sales were off-market, the highest share of the three cities, and a strong signal of how relationship-driven this micro-market is given its limited inventory.
- Manhattan Beach: 35% of $5M+ sales were off-market, still more than one in three, despite being the deepest and most liquid of the three markets.
- Redondo Beach: 0% off-market. Both sales this year went through a traditional listing process, though the small sample size limits what we can conclude here.
Why this matters: at the $5M+ level, a meaningful share of South Bay's luxury inventory never reaches public search portals, open houses, or even the broader agent network. Buyers relying solely on public listings are missing out on roughly 4 in 10 of the deals actually happening at this price point. This is precisely why relationships, off-market networks, and a well-connected agent matter more as price points rise.
What's Commanding the Biggest Results
Looking at the top of the market (the ten highest sales YTD, ranging from $10.7M to $17M), a few product characteristics repeat:
- The Strand and immediate walkstreets dominate the top tier. Several of the highest-dollar and highest-per-foot sales this year are Strand or near-Strand properties in Hermosa Beach and Manhattan Beach.
- New, architecturally distinct construction outperforms. Homes built or substantially rebuilt within the last few years, particularly in the 5–8 bedroom range with elevators, ocean-view rooftop decks, and high-end finish packages, are consistently landing at or above list price.
- Larger lots in Redondo Beach can produce outsized results, but need longer marketing runways. The two Redondo sales this year (including the $17M Paseo De La Playa estate) show that trophy-level results are achievable, but likely require patience and a more targeted buyer search given lower overall inventory turnover at this level.
- Pool, view, and true walk-to-the-sand locations remain the clearest value drivers across all three cities. These features show up disproportionately often among the highest-dollar and fastest-selling properties in the data set.
Interest Rates YTD: The Backdrop Behind the Numbers
Mortgage rates have moved meaningfully in 2026, and the timing lines up with buyer activity in this data set:
- Rates fell to a 2026 low of roughly 5.98% in February, per Freddie Mac and Wells Fargo tracking, the most attractive financing window of the year so far.
- Listing activity in this data set spiked in February through April 2026 (28 of the 75 qualifying properties were listed in that window), directly overlapping with the low-rate window.
- Rates have since climbed back toward 6.5%, with the 30-year fixed averaging 6.49% as of early July 2026, driven in large part by geopolitical developments (including the Iran conflict) that pushed rates up roughly half a point from their spring lows.
- Fannie Mae's current forecast has rates holding around 6.4% for the balance of 2026, suggesting the rate environment will likely stay a background factor rather than a major swing factor through year-end.
What this means at the $5M+ level: a large share of buyers at this price point are cash or low-leverage, so rate sensitivity is muted compared to the broader market, but it's not absent. The February–April listing surge suggests sellers and their agents were reading the rate window correctly and timing launches to catch buyers while financing costs were most favorable, even in a segment where financing plays a smaller role than at lower price points.
The SpaceX Effect: One Influence Worth Watching
SpaceX completed its IPO on June 12, 2026, raising roughly $75 billion, the largest IPO on record. Because SpaceX's largest employee base sits in nearby Hawthorne, it's worth flagging as a factor in the South Bay's luxury market:
- 4,000+ employees are expected to become millionaires from the IPO, with about 400 crossing $100 million.
- El Segundo and Manhattan Beach are widely viewed as the primary beneficiary markets given their proximity to Hawthorne.
- The impact is expected to build over several years as stock lock-up periods expire, rather than showing up as an immediate spike. Our data doesn't yet show a clean, isolated bump, but it's a trend worth watching over the next several quarters.
Other Corporate Tailwinds in the South Bay
SpaceX isn't operating in isolation. The broader South Bay/El Segundo corridor has seen a wave of corporate investment that supports the area's high-earner employment base:
- Mattel purchased a 168,000-square-foot office building in El Segundo for $59 million, expanding its footprint near its existing headquarters.
- The Los Angeles Chargers relocated their headquarters to El Segundo, reinforcing the city's emergence as a hub beyond aerospace and tech.
- Varda Space Industries leased over 200,000 square feet of former Mattel space in El Segundo in 2026, adding another well-funded aerospace employer to the corridor.
- Bay Club completed a $42 million acquisition of a 5.4-acre campus in El Segundo, signaling continued confidence in long-term demand for premium lifestyle amenities in the area.
Taken together, this cluster of aerospace, tech, entertainment, and lifestyle investment continues to reinforce the South Bay, and Manhattan Beach in particular, as a primary landing spot for the region's highest-earning employees, which is a structural tailwind for the $5M+ home market independent of any single company's news cycle.
Key Takeaways
- 75 closed $5M+ sales YTD across Manhattan Beach, Hermosa Beach, and Redondo Beach, totaling $573.4 million in volume.
- Manhattan Beach leads on volume; Hermosa Beach leads on price per square foot; Redondo Beach remains a small but capable trophy-home market.
- Nearly 39% of all sales closed off-market, the single most important data point for anyone trying to buy or sell in this tier without a well-connected agent.
- Homes that sell within two weeks sell for a premium (105% of list on average); homes that linger past 30 days see meaningful price erosion.
- Rates bottomed near 5.98% in February and have climbed back to roughly 6.5%, with listing activity clustering around the low-rate window.
- SpaceX's $75B IPO is a structural, multi-year tailwind for Manhattan Beach and the broader South Bay, layered on top of continued corporate investment from Mattel, the Chargers, Varda Space, and others.
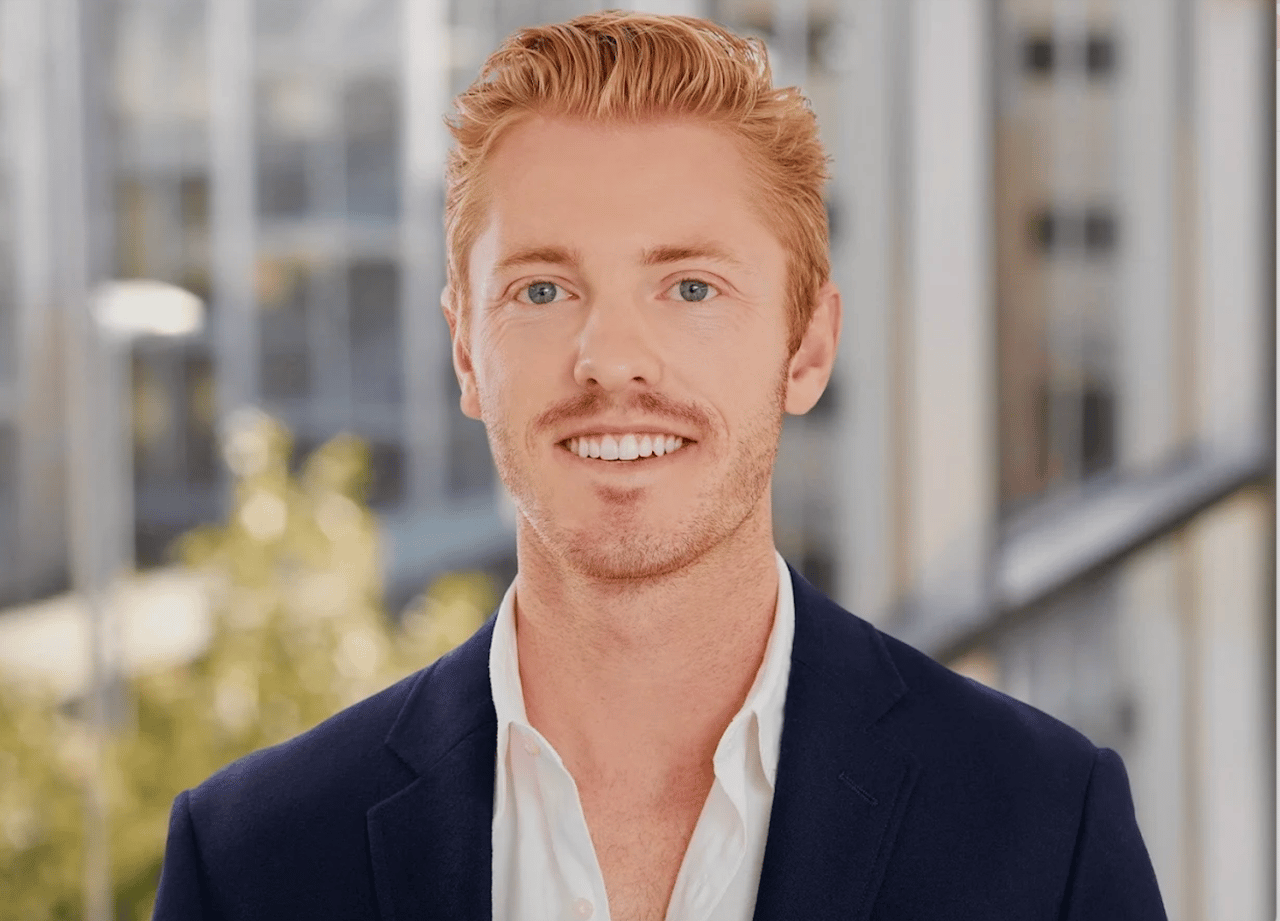
Jagger Kroener & Lauren Forbes: Leading Producers in the South Bay's $5M+ Market
This data set isn't just something we track from the sidelines. It's a market we actively compete in. Year-to-date, Jagger Kroener and Lauren Forbes have conducted 9 transactions at $5,000,000 and above across Manhattan Beach and Hermosa Beach, including:
- 1721 2nd St, Manhattan Beach: $5,150,000
- 337 10th St, Manhattan Beach: $5,410,000
- 721 Marine Ave, Manhattan Beach: $5,650,000
- 1801 Oak Ave, Manhattan Beach: $5,700,000
- 2304 Hermosa Ave, Hermosa Beach: $5,925,000
- 2435 Manhattan Ave, Hermosa Beach: $7,495,000
- 109 S Poinsettia Ave, Manhattan Beach: $8,920,000
- 413 7th St, Manhattan Beach: $9,200,000
- 1807 Valley Park Ave, Hermosa Beach: $14,000,012
That's more than $67.5 million in combined sales volume and roughly 1 in 8 of all $5M+ single-family home sales closed in Manhattan Beach and Hermosa Beach so far this year, putting Jagger and Lauren among the most active producers in the South Bay's ultra-luxury tier. That volume of first-hand transaction experience is exactly what informs the data and trends covered in this report: this isn't outside commentary on the luxury market, it's a firsthand view from two of the agents actively shaping it. If you're considering buying or selling a $5M+ home in the South Bay, that track record and market knowledge are here to work for you.
Frequently Asked Questions
How is the luxury real estate market doing in the South Bay in 2026?
Through mid-2026, the $5M+ single-family home market in Manhattan Beach, Hermosa Beach, and Redondo Beach remains active and resilient, with 75 closed sales totaling roughly $573 million. Manhattan Beach leads in volume, Hermosa Beach commands the highest average price per square foot, and sale-to-list ratios remain strong (97–99%) in Manhattan Beach and Hermosa Beach.
What percentage of South Bay luxury homes sell off-market?
Roughly 39% of $5M+ single-family home sales across Manhattan Beach, Hermosa Beach, and Redondo Beach closed off-market year-to-date in 2026, meaning they never appeared with active days on market on the open MLS. Hermosa Beach had the highest share at 61.5%.
What is the average price per square foot for luxury homes in Manhattan Beach and Hermosa Beach?
Manhattan Beach's average $5M+ sale price is roughly $2,064 per square foot; Hermosa Beach's average is roughly $2,548 per square foot, reflecting its smaller, denser, and more land-constrained inventory, particularly on The Strand and walkstreets.
Is SpaceX's IPO affecting home prices in Manhattan Beach and the South Bay?
SpaceX's June 2026 IPO created significant concentrated wealth among employees based in nearby Hawthorne, and Manhattan Beach and El Segundo are widely viewed as the primary beneficiary markets. The effect is expected to build over multiple years as stock lock-up periods expire, rather than showing up as an immediate price spike.
How do days on market affect final sale price in the South Bay luxury market?
Homes that go under contract within 14 days sell for an average of 105% of list price. Homes that sit on the market for 31–60 days see sale-to-list ratios drop to roughly 89.5%. Pricing accurately from day one is strongly correlated with stronger final results.
This report is based on MLS closed sales data for single-family residences priced at $5,000,000 and above in Manhattan Beach, Hermosa Beach, and Redondo Beach, year-to-date through mid-July 2026. Interest rate data sourced from Freddie Mac, Wells Fargo, and Fannie Mae public forecasts. Corporate and SpaceX market context sourced from public reporting.
Curious how these trends apply to your specific property or search? Reach out: I track this market in real time and I'm happy to walk through the data with you.
Disclaimer: This report is for informational purposes only and should not be relied upon for any real estate, investment, financial, or legal decisions. While data is believed to be accurate as of the date of publication, it is not guaranteed and may be subject to change or revision. Please consult a licensed real estate professional before making any decisions based on this information.